
Bitcoin Is Coiling. The Spring Breaks at $126K.

The monthly chart tells a story most traders are ignoring. Here's what the key levels, the wedge structure, and those two arrow projections are really saying.
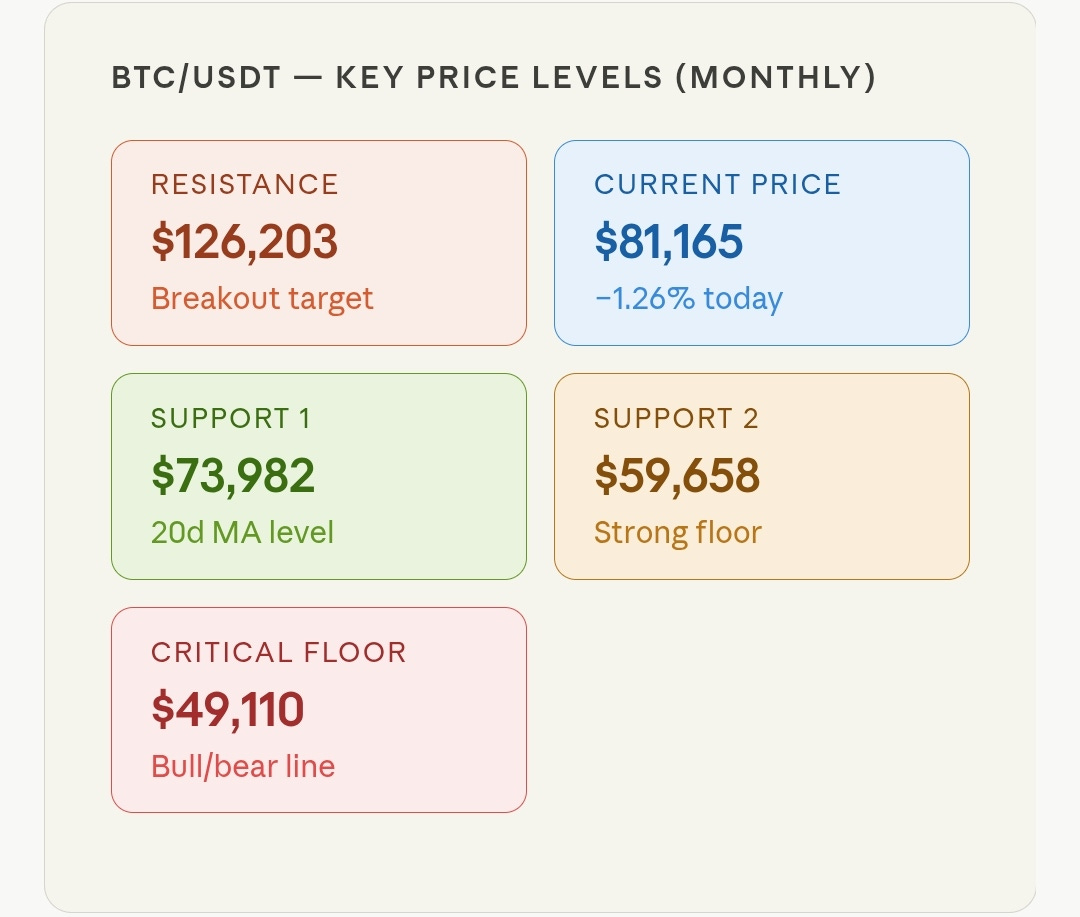
Every major Bitcoin bull run has had a moment that looked like the end — a brutal, gut-wrenching correction that wiped out the weak hands, triggered the headlines, and set the stage for the parabolic move nobody expected. We may be living through that moment right now.
The monthly BTC/USDT chart is one of the most actionable charts in crypto right now. At $81,165, Bitcoin is sitting inside an ascending wedge that has been forming since early 2024 — and the price action is approaching a resolution point that will define the next 12–18 months.
"The $120K–$126K zone isn't just resistance. It's the door. And once it opens, there's very little between here and $240K."
The Structure: What the Wedge Is Telling Us
The ascending wedge visible on the monthly chart stretches from the 2024 lows all the way up through the recent all-time high attempts. Price has been making higher lows and higher highs, but the highs are converging — a classic sign of compression before an explosive directional move.
The current candle is hugging the lower boundary of that wedge near the $73,982–$81,000 range. This is exactly the zone where bulls need to hold. A weekly or monthly close below $73,982 opens the door to a retest of $59,658 — and the most extreme scenario puts Bitcoin back at the $49,110 red line, which is the definitive bull market invalidation level.
Two Scenarios: The Chart Shows Both
The chart author has drawn two arrow projections — and they deserve serious attention. They're not bullish or bearish in isolation. They're sequential. Here's how to read them:
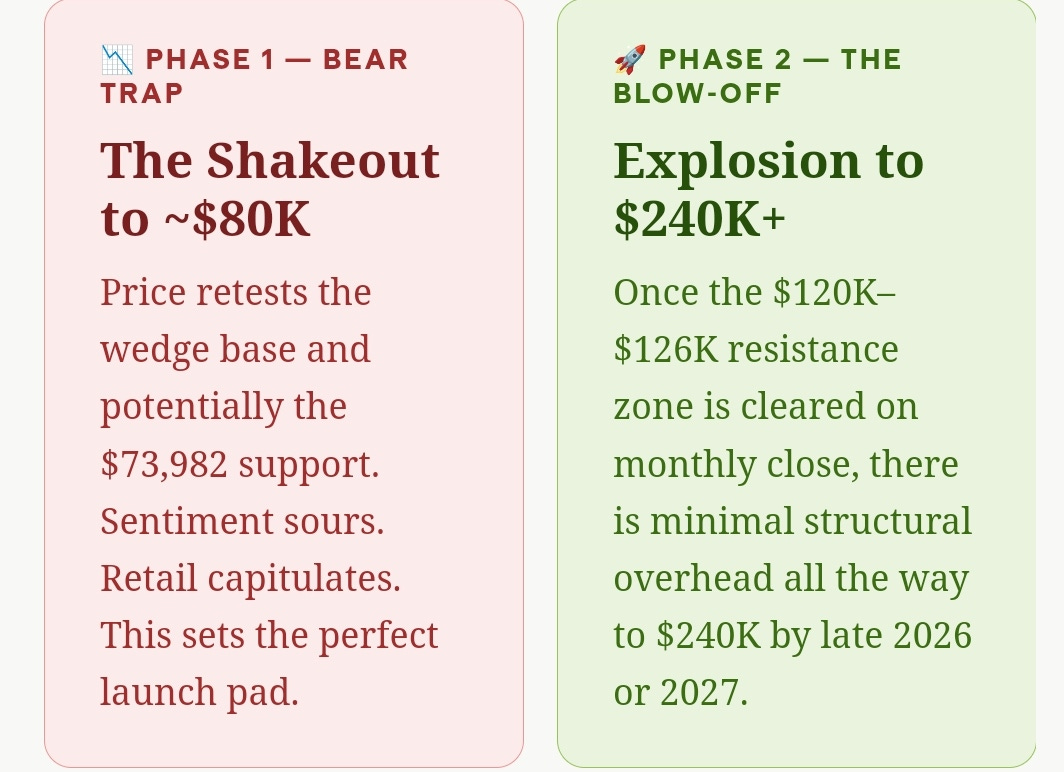
The key insight here is that the blue arrow (the more aggressive projection) targets above $240,000 — while the purple arrow shows a slightly more conservative path to a similar destination. Both agree on the direction. They disagree only on the speed and the depth of the pre-launch dip.
The $120K–$126K Zone: The Gate
The pink shaded zone between $120,000 and $126,203 is the single most important area on this chart. It represents the prior resistance cluster where Bitcoin has twice failed to close above on a monthly basis. Until that zone is reclaimed and held, the bull thesis remains potential rather than confirmed.
What makes this level even more significant is that it aligns with the upper boundary of the wedge. A clean breakout and monthly close above $126,203 would simultaneously clear the horizontal resistance AND break above the wedge — a confluent signal that has historically preceded the most violent moves in Bitcoin's history.
The Floor: Why $49,110 Is the Line in the Sand
The red horizontal line at $49,110 is not a level to trade against speculatively — it's a structural divider. Above it, Bitcoin is in a macro bull market by any technical definition. Below it, the entire 2024–2026 bull cycle narrative collapses, and a reset toward the $20K green demand zone becomes a real possibility.
The good news? We are $32,000 above that line right now, and every weekly close since mid-2024 has remained well above it. The bulls have ample room to breathe — and absorb — before anything truly alarming occurs.
"Don't mistake a pause for a reversal. Bitcoin has been here before — and every time the chart looked like this, the move that followed was the one people kicked themselves for missing."
The Trade Setup
For swing traders: the $73,982–$80,000 range offers an asymmetric risk/reward entry on monthly timeframes, with a stop below $49,110 and targets at $126,203 (first), then open sky above. The risk is roughly 40%, the reward to first target is 55%, and the reward to the $240K projection is close to 200%.
For long-term holders: nothing on this chart suggests the macro bull market is over. The structure is intact. The levels are holding. The coil is tightening. Patience here — historically — has been the highest-returning strategy of all.
Bottom Line
Bitcoin is at a decision point on the monthly chart. The wedge is compressing, the key support levels are clearly defined, and the $126,203 resistance zone will tell us everything about the 2026–2027 cycle. The chart says: hold the range, break the gate, or face the consequences. Watch the monthly closes. They won't lie.
NFA always DYOR before investing.
CryptoVhagar.
We need a 50% rise to break the 126k. How do we get that?